Monitoring Performance - HEAVYQUERY
24.1
As developers, dealing with performance issues (related to our own developments or otherwise) can be tricky. Reports are usually after the fact and are often very vague (“the system is slow!”). To help deal with these issues, Priority includes Heavy Query Monitoring.
Heavy Query Monitoring provides detailed information about slow-running queries, including when they occurred, which process (form, procedure, or trigger) executed them, and which user triggered the operation. Use this tool to efficiently identify and resolve performance issues during system investigations.
Requirements & Availability
- Cloud: Enabled in Priority Cloud (AWS) starting v24.1.
- Local (on-prem) installations, available from the following Bin versions:
- v25.0 - BIN 25.0.13 or later
- v24.1 - BIN 24.1.36 or later
Setup
To enable monitoring:
- Open the System Constants form (System Management > System Maintenance > Constant Forms > System Constants) and locate the HEAVYQUERY constant.
- In the value field, define a threshold in whole seconds of what is considered to be a “heavy” query. An initial value of 3-5 seconds is recommended.
Usage
Once enabled, SQL queries that exceed the defined threshold will be recorded in the List of Queries in Process form (System Management > System Maintenance > Periodic Maintenance > List of Queries in Process).
The form shows the following information:
- Query Duration-Sec - the duration of the heavy query itself.
- Process Duration-Sec - the total runtime of the process (form/procedure/trigger) that executed the statement. If the process is still running, the value will be 0.
- Date and time in which the process was run
- Process Name and entity type (form/procedure/trigger).
- User Name of the user who started the process, and the Full Company Name in which the process was run.
The subform shows the text of the query and the RETVAL returned.
You can also look into the process in question in the List of Recent Processes form (System Management > System Maintenance > Periodic Maintenance > List of Recent Processes) to find out some more information, such as the internal name of the entity. Starting with version 25.0, you can also find the input used for procedures and reports in the sublevel.
Note that heavy queries can also be generated when users run a search from a form (F11). This might indicate you need an index on a specific table column, or provide an opportunity to coach users on how to better optimize their queries.
Keep in mind that in order to prevent heavy query records from balooning and taking up too much DB space, they are removed after a minimum of a week has elapsed. The exact deletion time depends on when routine maintenance processes are run.
Example
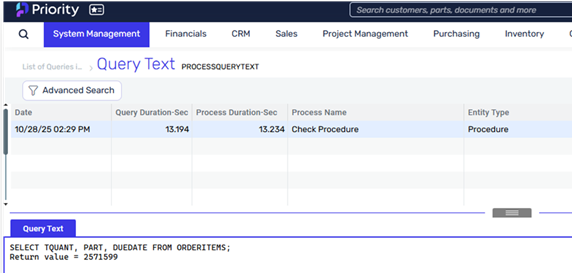
In this example, the procedure ran for 13.234 seconds. Of this time, 13.194 seconds were spent executing the query shown in the image, which returned a RETVAL of over 2.5 million records.
Best Practices
- Start with 3–5 seconds for initial rollout; adjust later to fit your workload.
- Align user feedback with system activity - compare log times in the List of Queries in Process with user-reported issues and performance data.
- Target frequent issues - prioritize queries that are both slow and frequent.
- Track and follow up on issues - Identify high-impact issues and how often they show up, That way you can get clear insights, figure out next steps action, and review improvements after changes.
Limitations
REST API activity - Heavy Query Monitoring does not currently capture heavy queries originating from REST requests.